Categories
arduino C/C++ circuits Coding Embedded esp32 expressif Internet of Things microcontrollers MQTT sensors weather station WebSockets

SparkFun Weather Sensor Kit

Wind and Rain sensor kit newly arrived from SparkFun Electronics to upgrade an Arduino Weather Station project.
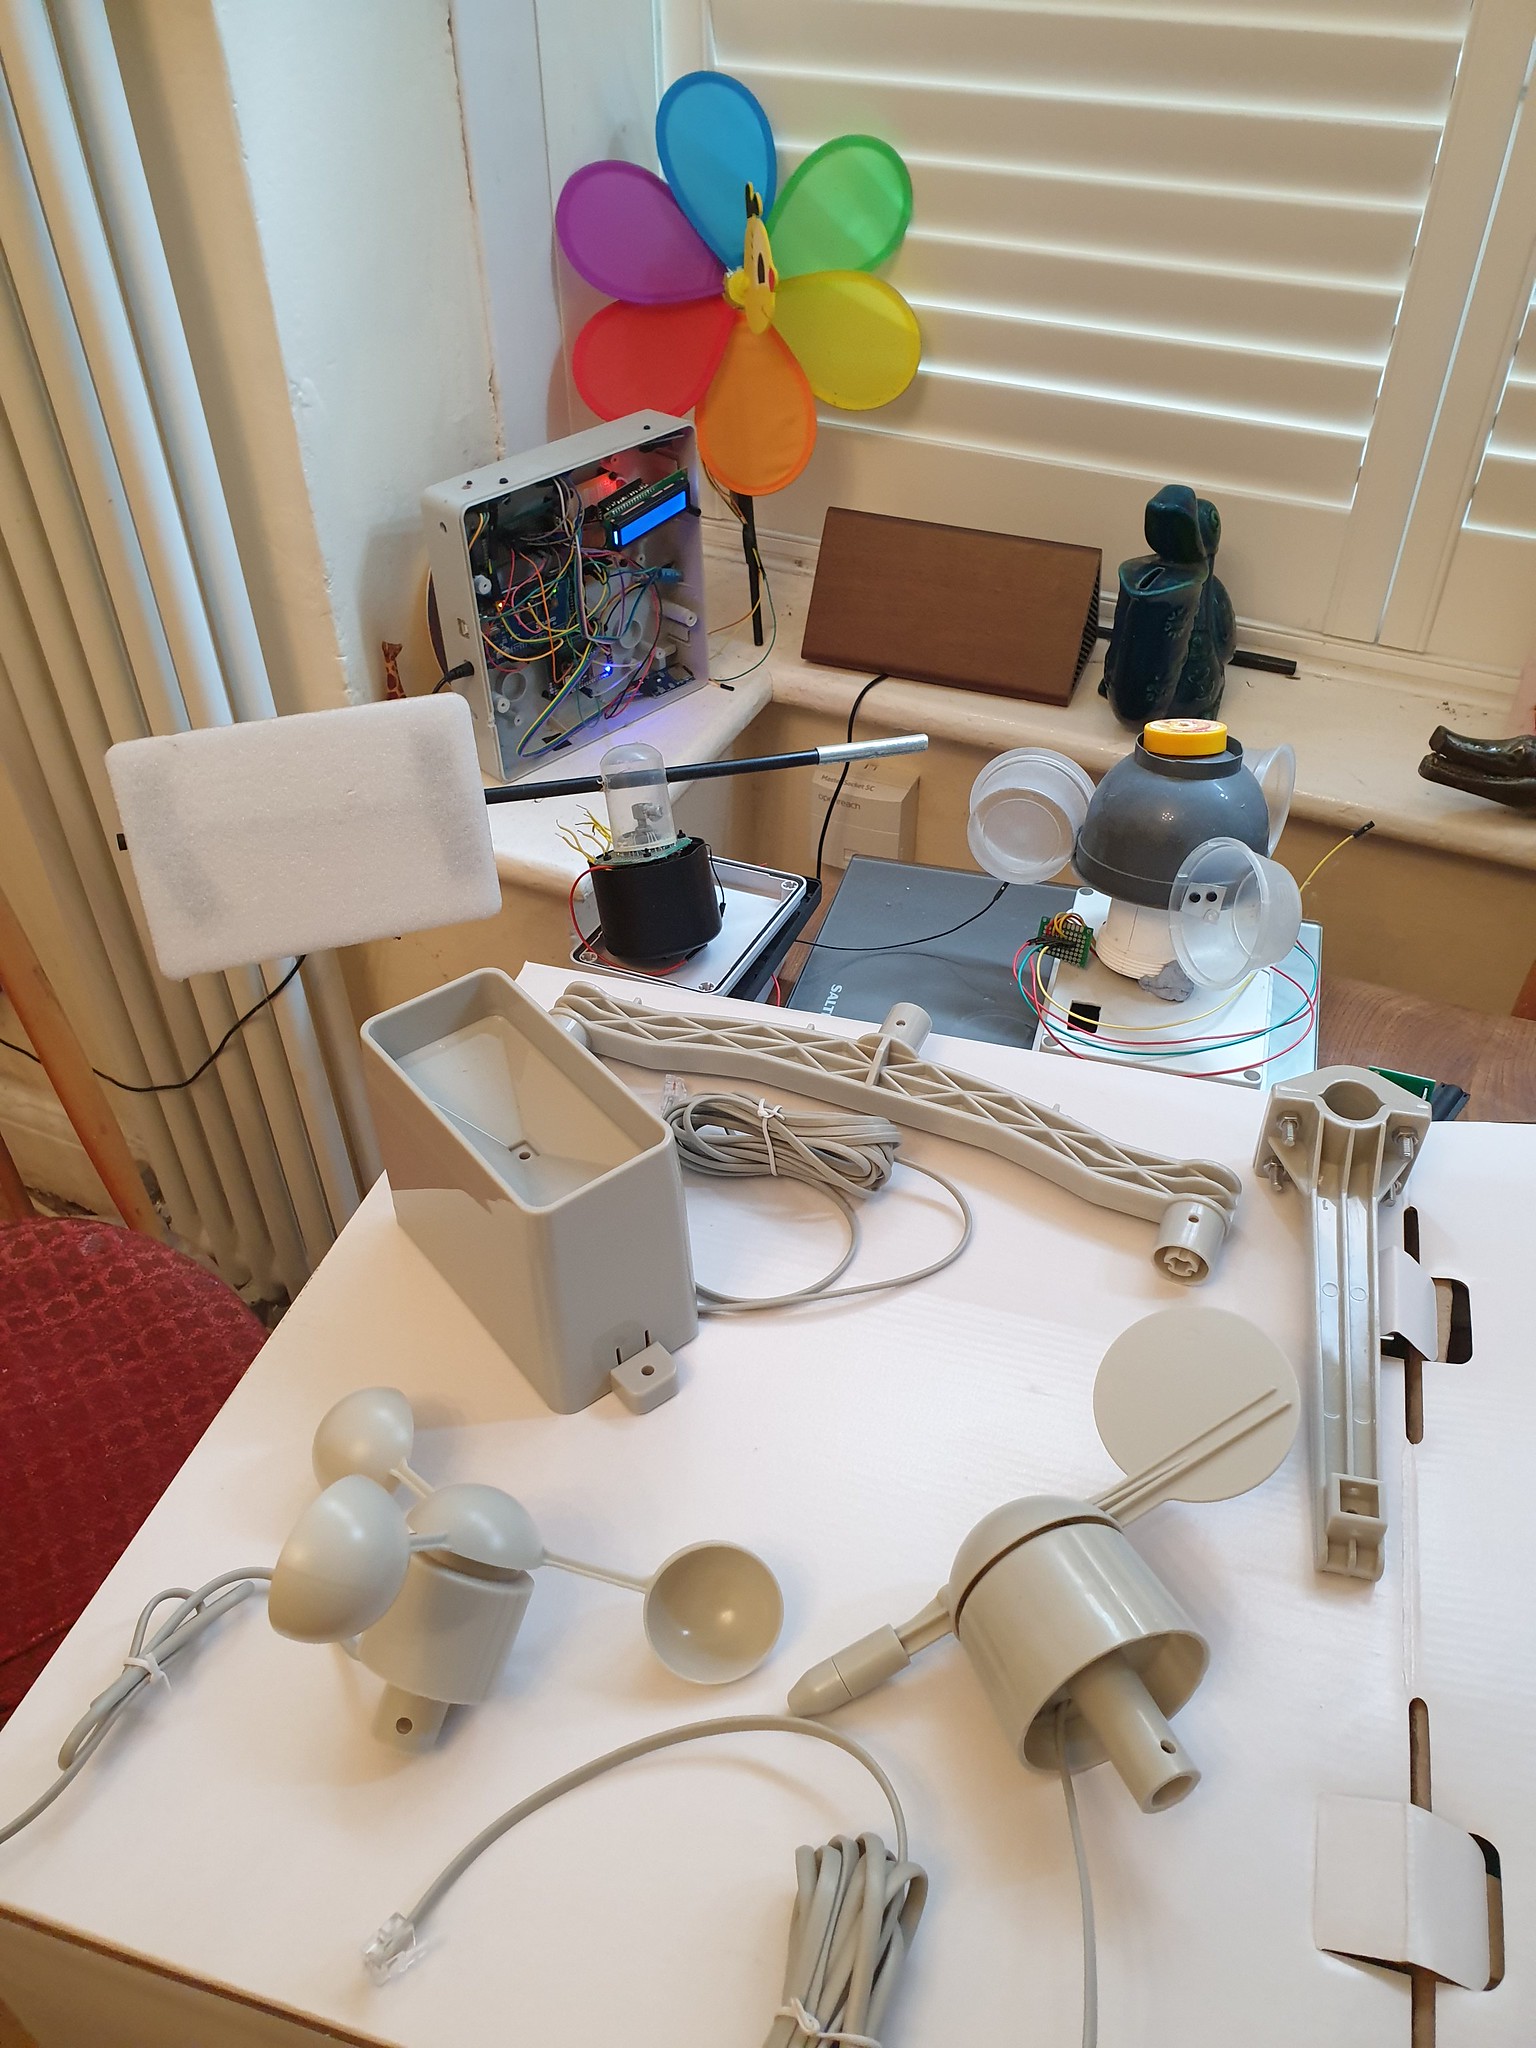
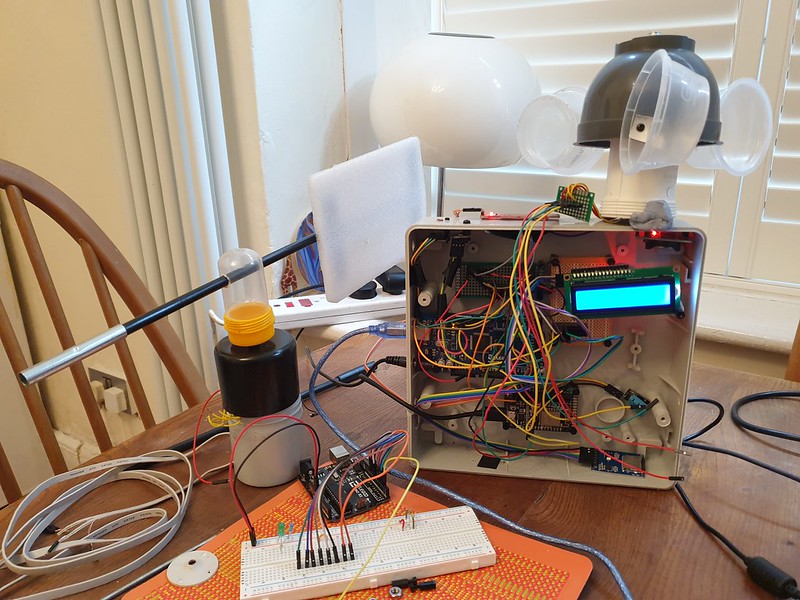
SparkFun Weather Sensor Kit, DIY prototypes, Arduino Weather Station

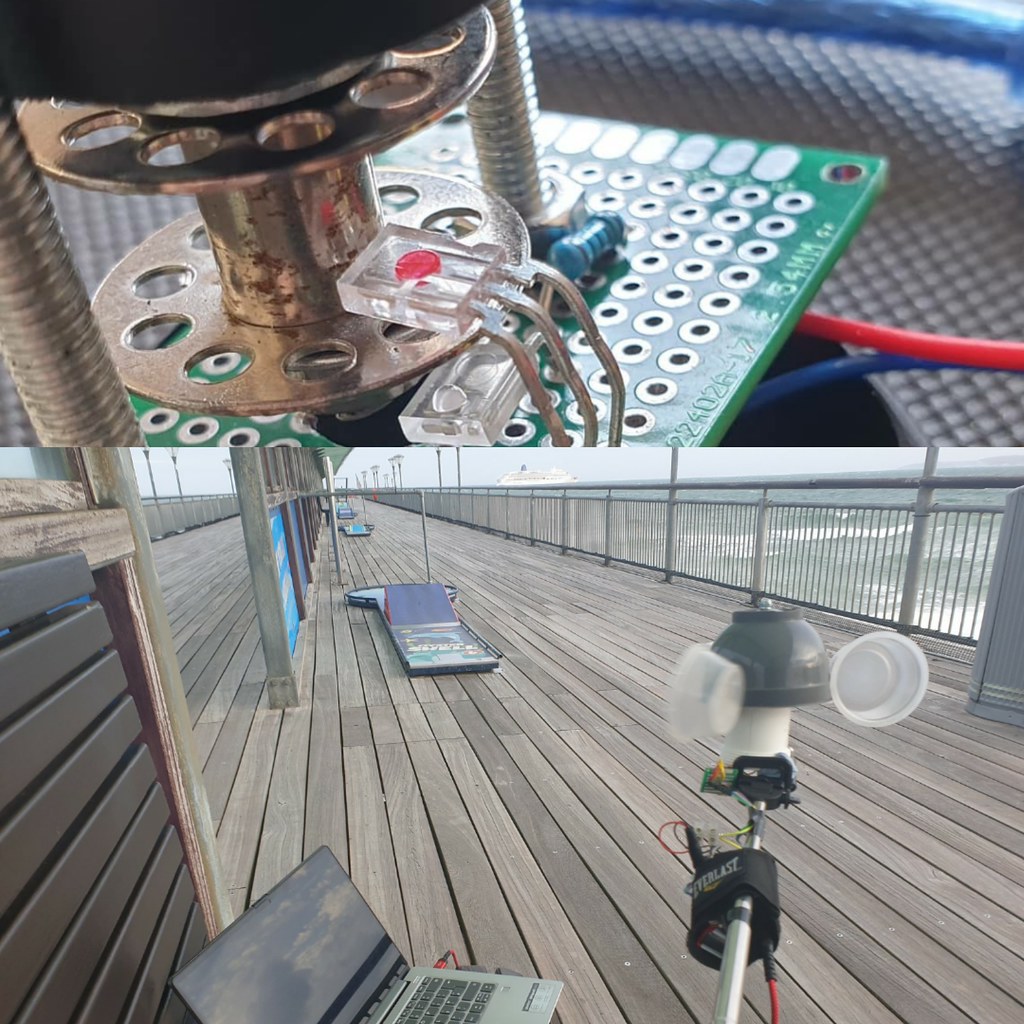
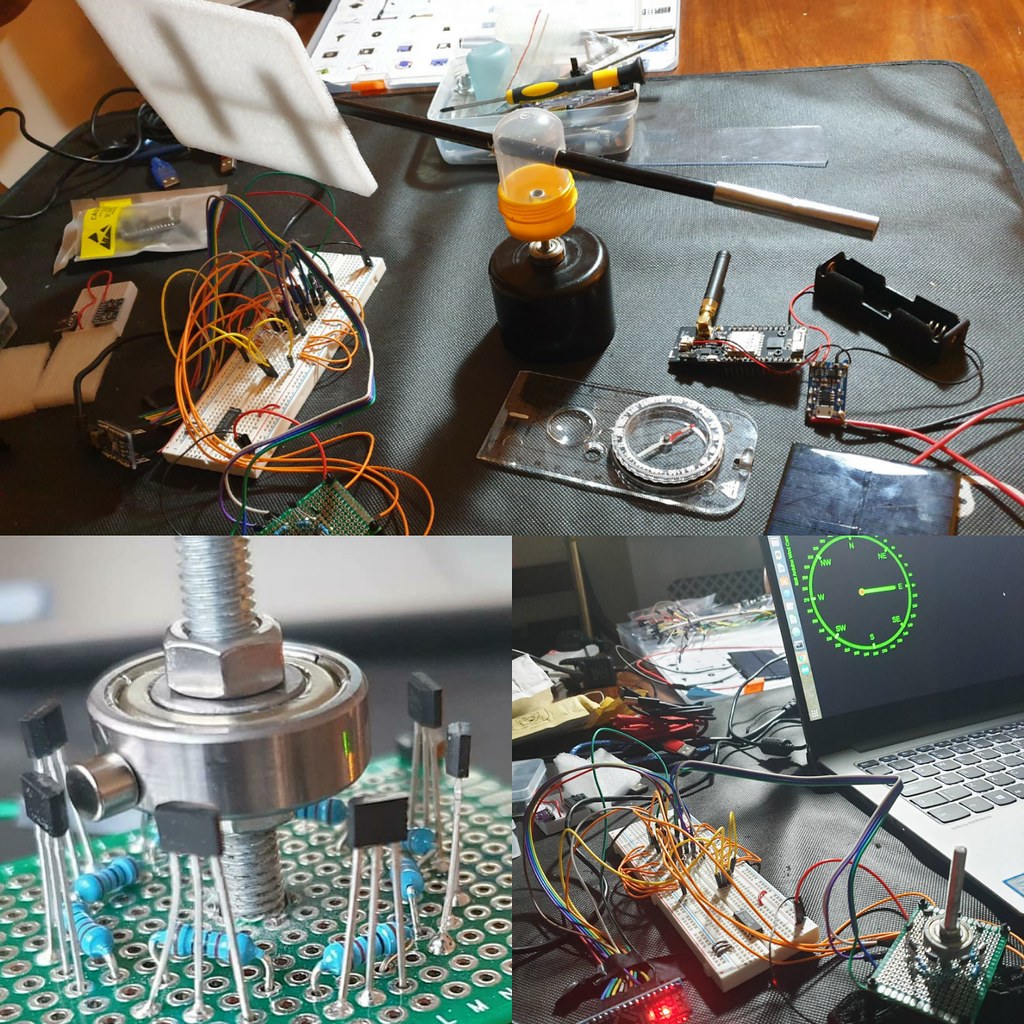
Also pictured are earlier DIY prototypes – a childrens bee wind spinner with hall effect sensor to count rotations, an anemometer made from recycled plastic packaging utilising a IR Led optical rotary encoder and a wind vane with eight fixed directional magnetic switches.

( more here: http://www.steveio.com/2020/07/21/weather-station-wind-vane-history-science/ and http://www.steveio.com/2020/07/21/weather-vane-hall-sensor-magnetic-rotary-encoder/ ).
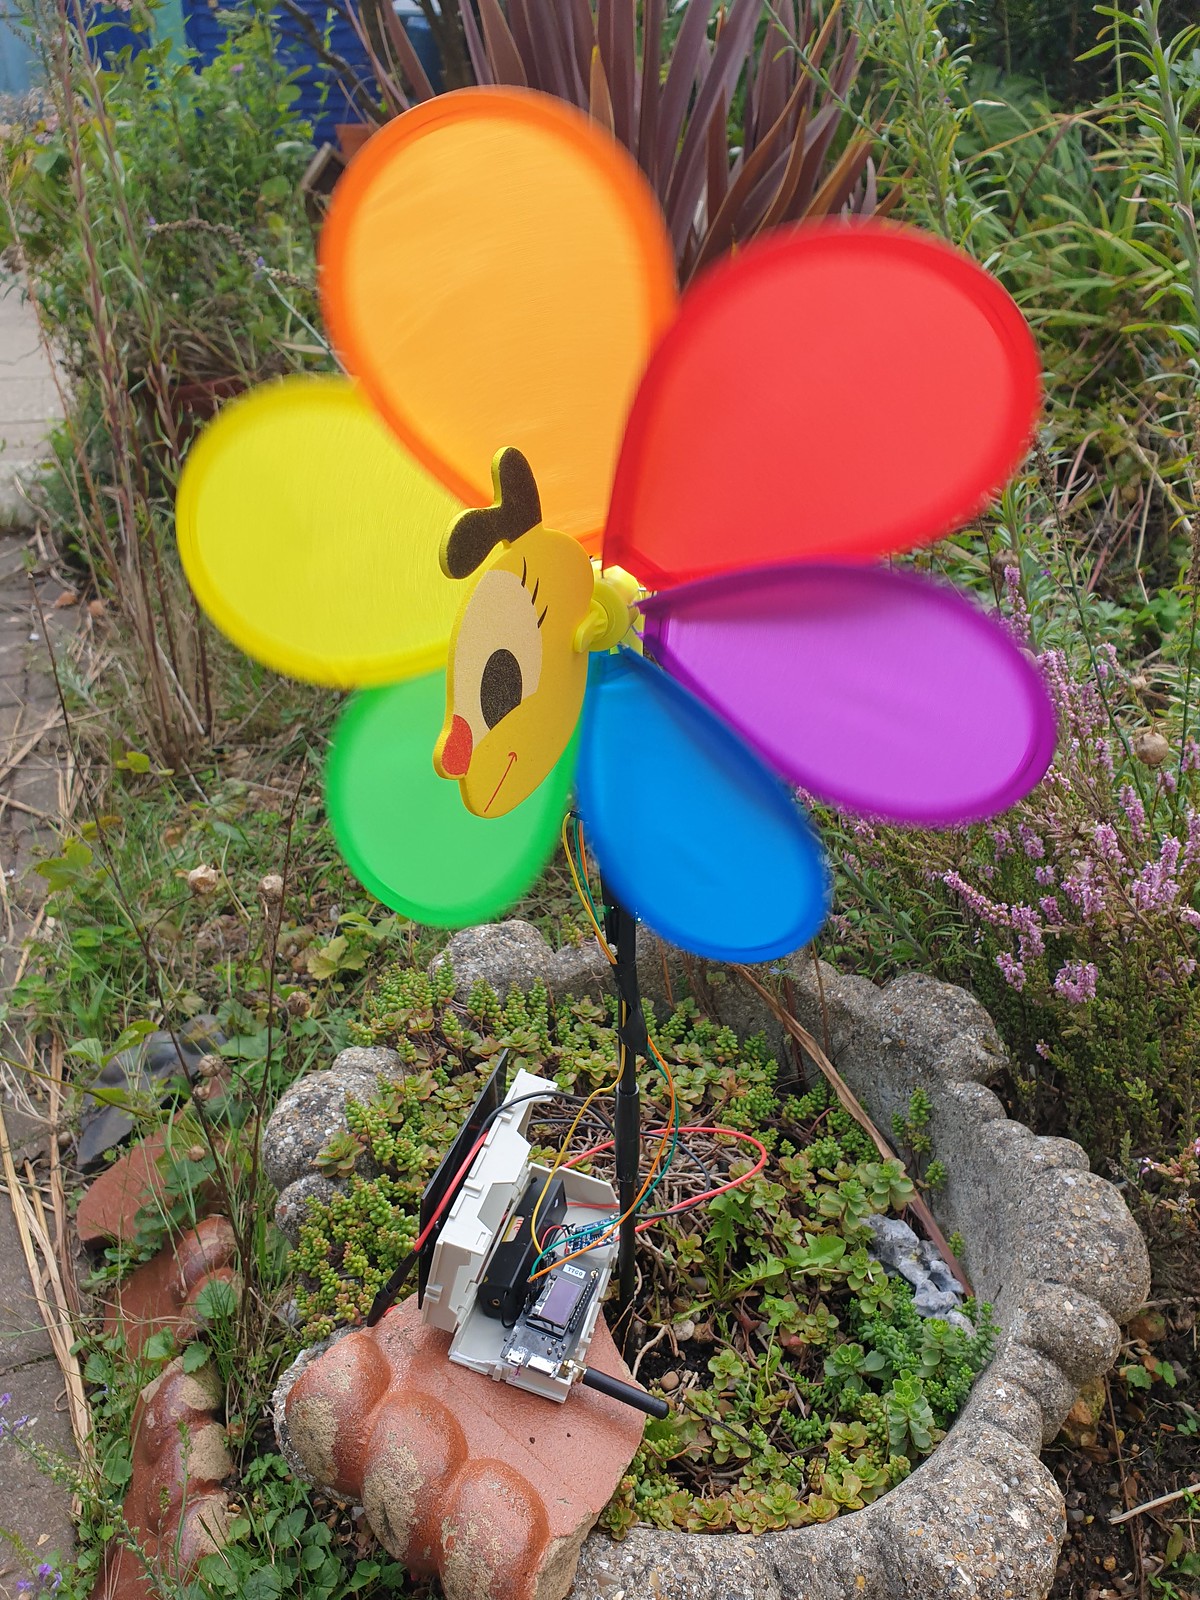
Bee Windmill Anemometer with ESP32 LoRa Transmitter running on single 3.3v Li-Ion cell.
8 Durection WInd Vane with magnetic hall sensor array and WebSocket TCP web browser interface.
ESP8266 Anemometer with optical IR Led sensor, wifi connectivity and D3.js websocket provisioned UI.

( Code for these projects can be found on GitHib. )

Weather station projects are a popular accessible introduction to microelectronics; a microcontroller and sensors can be found at low cost, modular hardware design results in easy assembly and open software platforms like Arduino IDE streamline packaging and deployment of code to devices.

Analysing real time or historical time series data, from weather sensors is a lot of fun. Frameworks like R Project for Math Stats: https://www.r-project.org/ ) and Python, Pandas, Numpy & Mathplotlib provide implementations of most alogirithms and convenient data structures for importing & manipulating data.

Techniques and methods are transferable and can be applied to other domains or ontologies – finanicial, accounting data for example.

SparkFun offer an OEM Wind & Rain sensor kit manufactured by Shenzen Fine Offset Electronics, China.

With advent of 3d modelling & printing it is also feasible for an enthusiast to design and fabricate via a 3d printer custom sensor components, perhaps using template models downloaded from repos like ThingiVerse.

In competition marine OpenWind are defining what smart network connected sensors can achieve utilising Bluetooth LE to make near real time wind data available on smartphone.
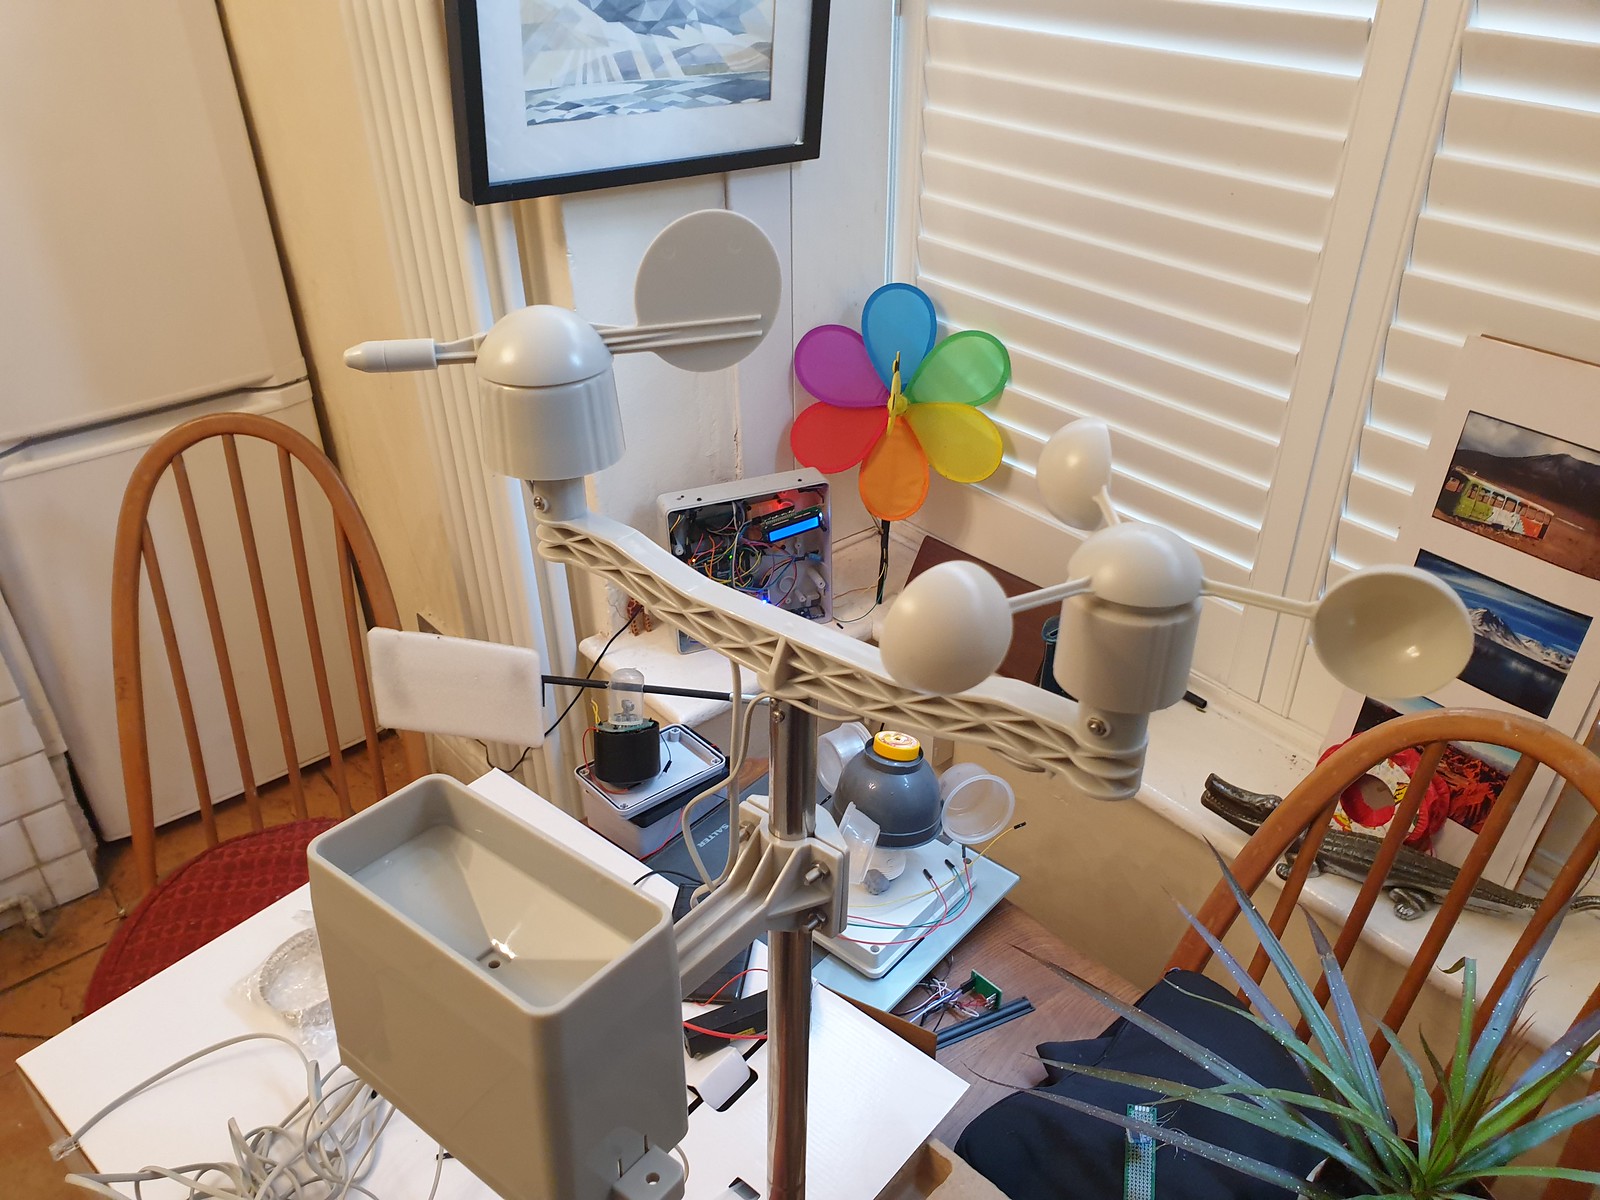
Assembled SparkFun Weather Sensor Kit

Ideal for enthusiast or educator SparkFun Weather kit comes wihout circuitry,  microcontroller or software.  An add-on PCB designed for use with  Arduino / ESP32 can be purchased or Datasheet Technical Specs provide reference sensor circuit designs, not significantly complex due to use of magnetic reed switch and variable resistance technology.
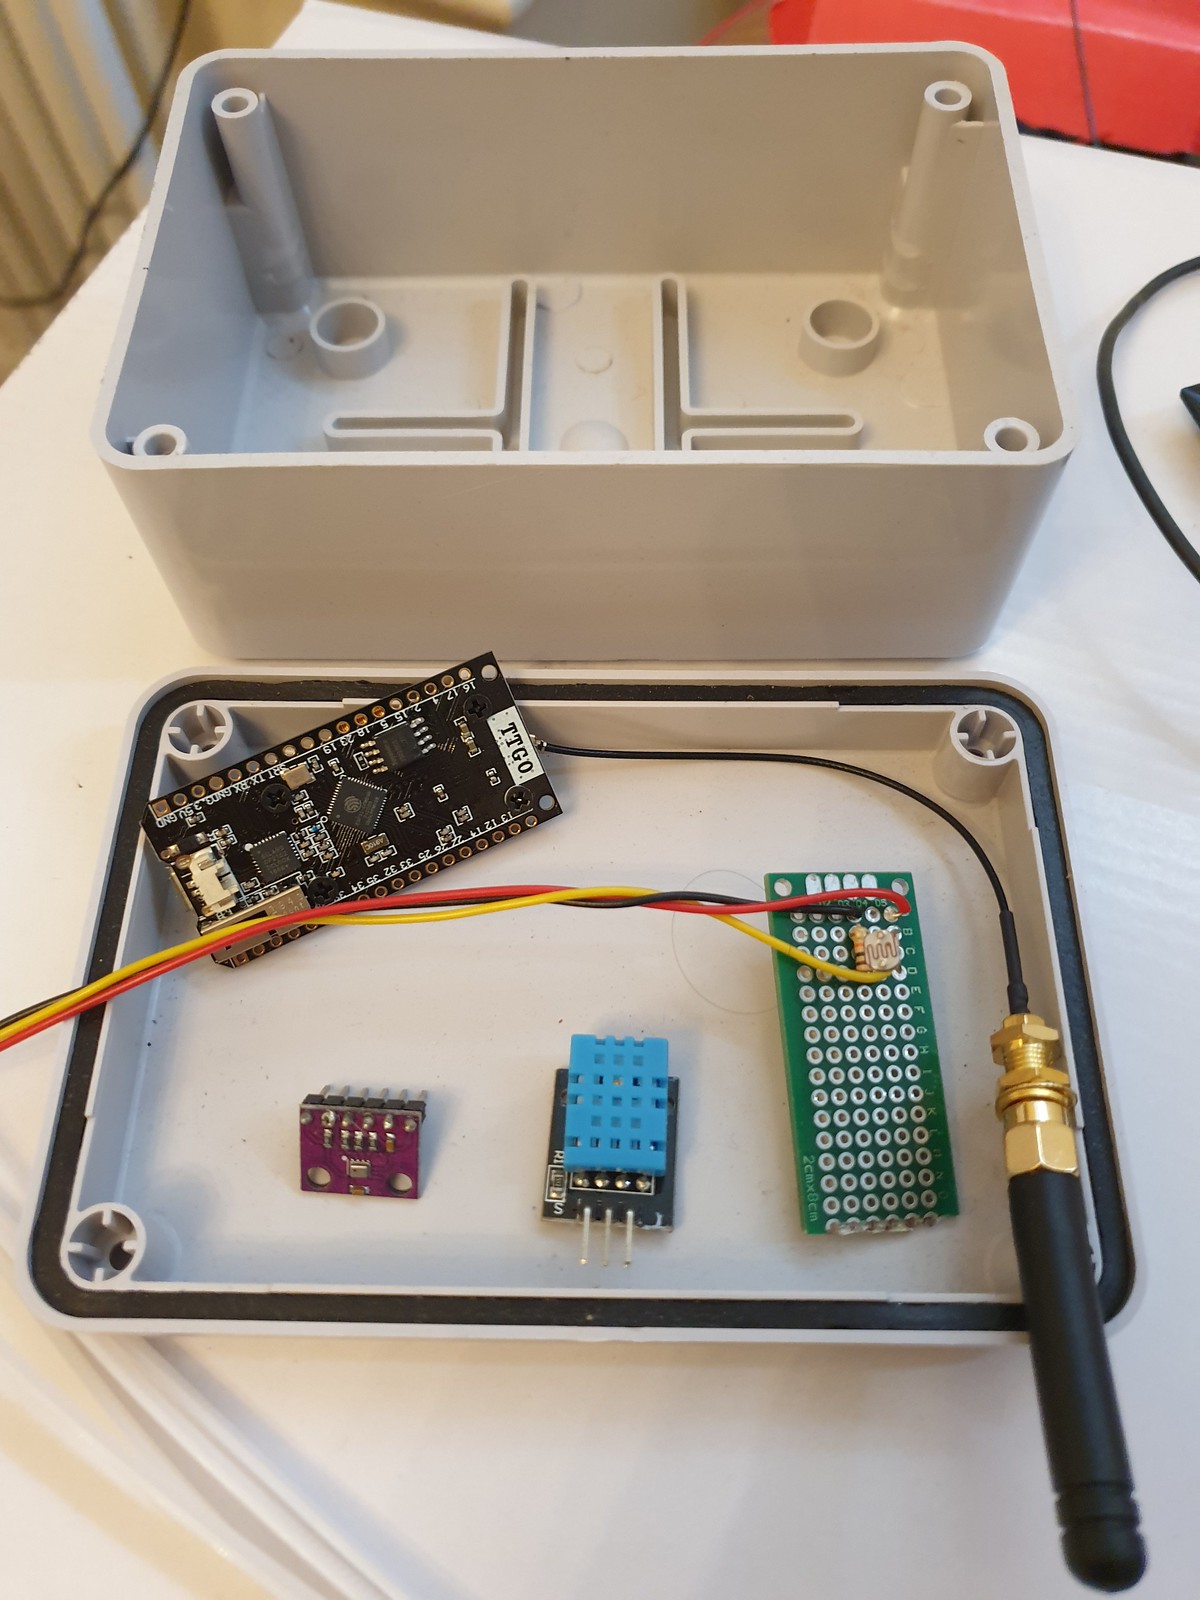
MCU Sensor Control & Relay Unit – IP67 Weather Proof Enclosure, ESP32 TTGO LoRa microcontroller, light, temperature and air pressure sensors.

Traditionally 433MHz RF has been used for base station to transmitter devices. A popular project is to use Arduino, a cheap 433Mhz receiver and a library to read data from a commercial weather station designed for use with manufacturers display, enabling this data to be provisioned to the cloud.

For data transmission non GPRS (cellular) options include Bluetooth LE (range ~100 metres) or LoRa (Long Range Low Power Network – range between 300 – 10km depending on antenae) offering cableless wireless connectivity allowing remote sensor situation with no associated network costs.

At data layer WebSockets and MQTT for IOT devices are challenging serial protocols as defacto lightweight, reliable & easy to implement transport relays.

Apart from range and connectivity goals of low power consumption for efficient and long battery running time combined with solar charging enable devices to run standalone for long periods.
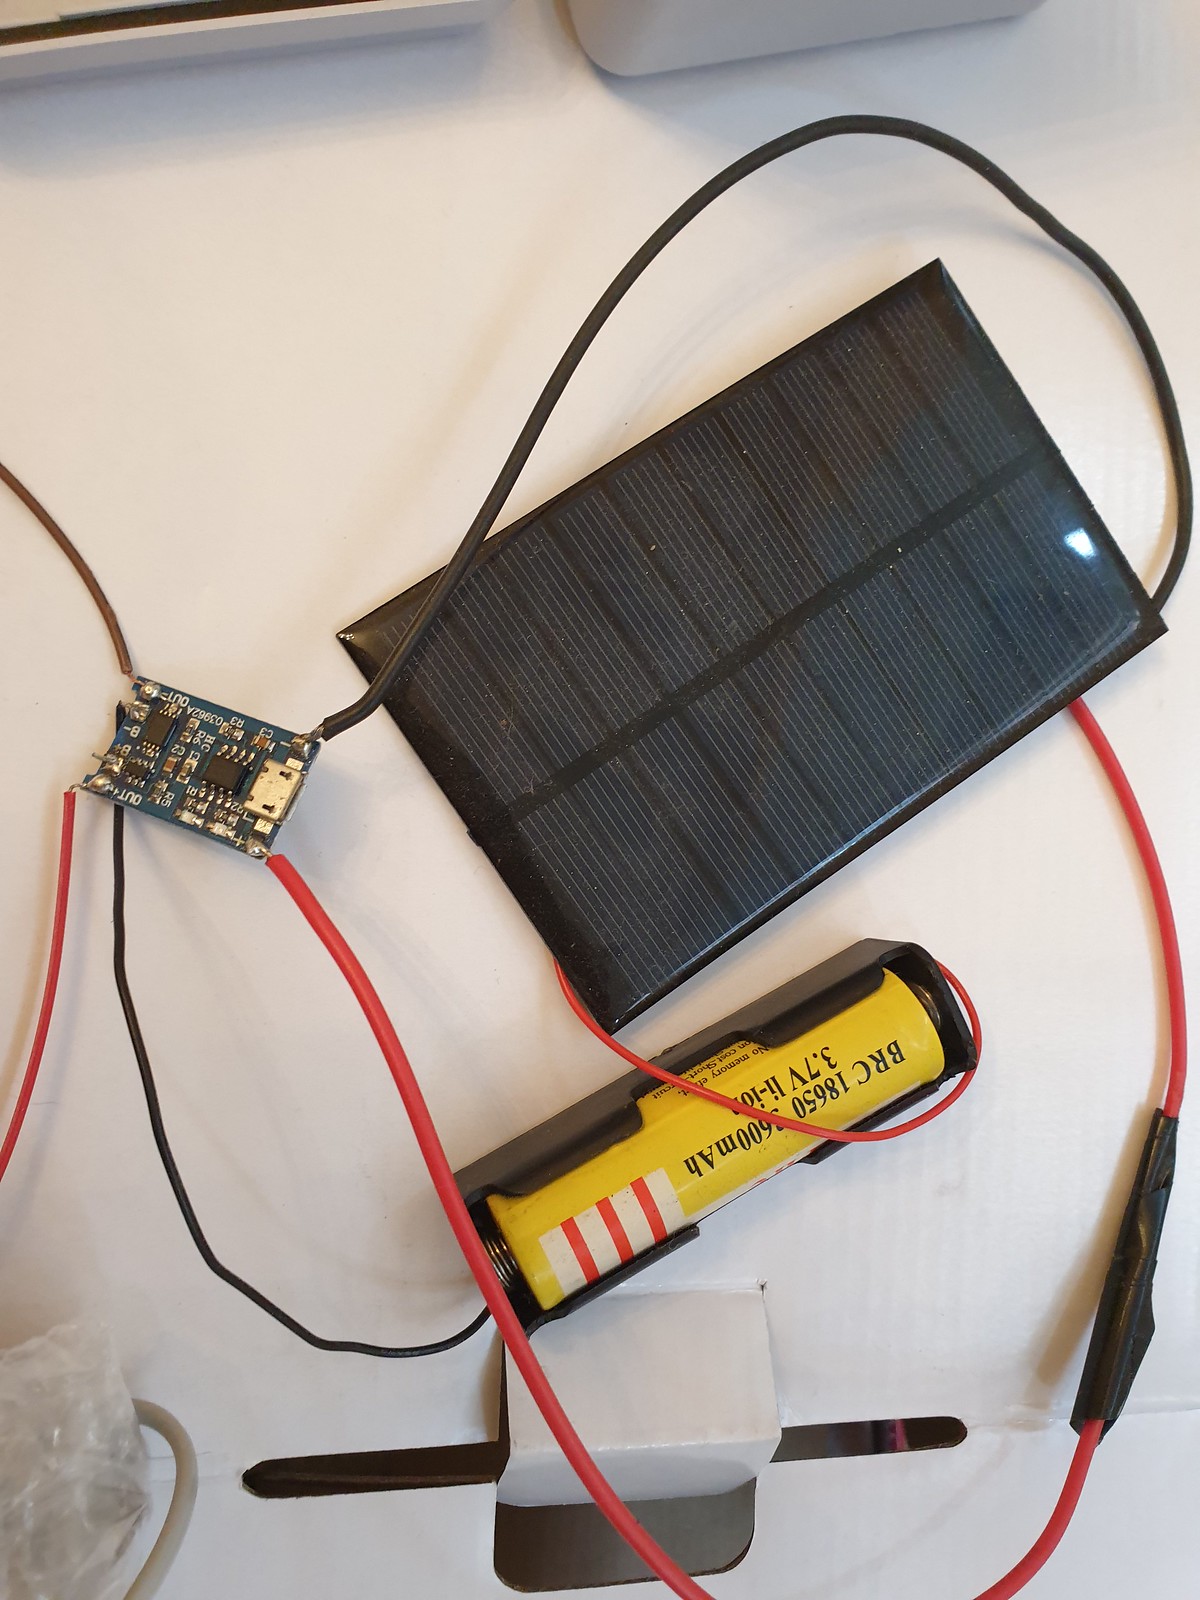
Is a single 3.3v Li-Ion Battery Cell Sufficient? TP405 Charging Module & Solar Panel

Weather Stations have applications beyond meteorology in smart agriculture, industrial, safety monitoring and for wind or wave based leisure pursuits. 
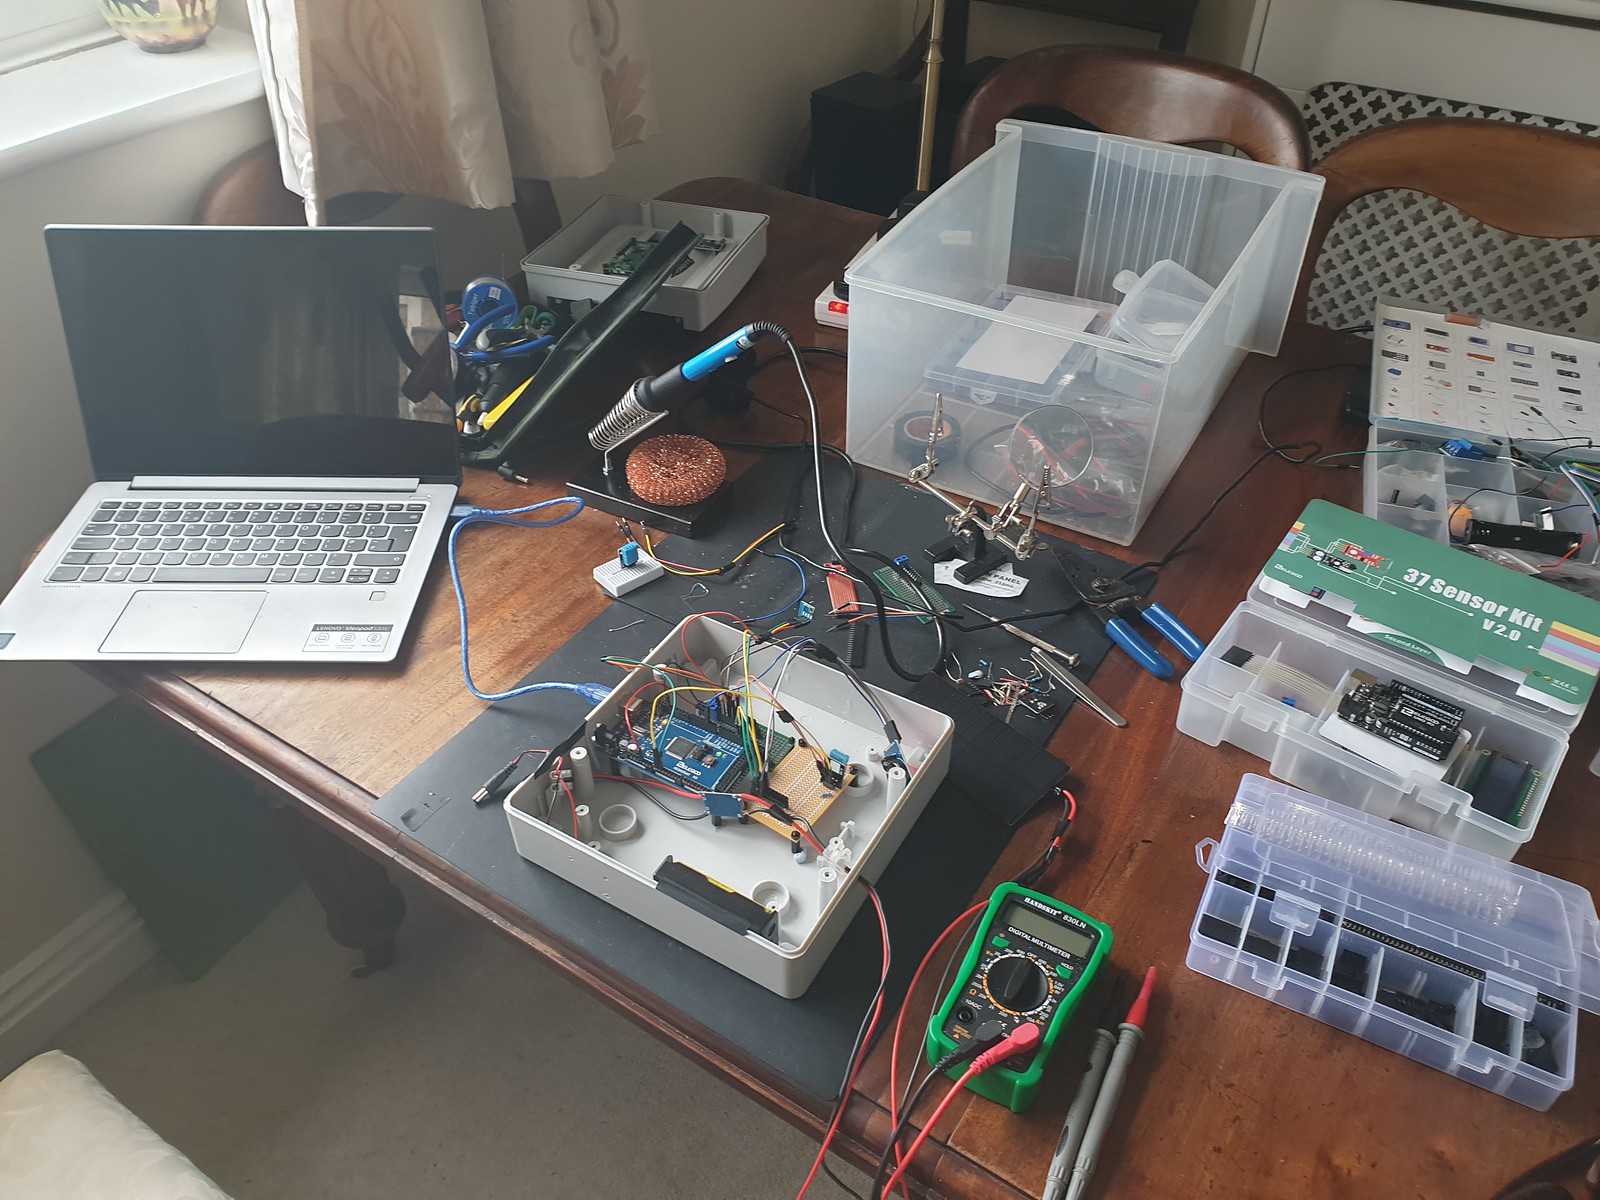
Assembling DIY Arduino Mega Weather Station v1.0

More generally Internet of things wireless networked smart sensor platforms can be used for many purposes and combined with AI and Machine Learning algorithms useful insight and patterns within data can be analysed, classified and predicted. 

SparkFun Smart ETextiles & Conductive Thread Kit

Personally, I really enjoyed SparkFun Arduino LilyPad e-textile, smart fabrics and conductive thread kit, so looking forward to now spinning up the Weather Station sensors!
Categories
arduino Coding Embedded Internet of Things Python weather station

Sunrise / Sunset Time visualised with Python, Pandas & Matplotlib

We can use Python Pandas & Mathplotlib libraries to quickly visualise sunrise / sunset timing data, but how to plot time as a number on a graph?

Sunrise / Sunset times are computed on my Arduino Weather Station using SunMoon library ( https://github.com/sfrwmaker/sunMoon ). Incredible that such a tiny 8 bit machine architecture can run this relatively complex algorithm with ease.

Data is logged every 30 mins to daily files stored on SD card in JSON text format.

stevee@ideapad-530S:~/Arduino/projects$ ls  ./data/weather/*.TXT | head -3
./data/weather/20200816.TXT
./data/weather/20200817.TXT
./data/weather/20200818.TXT

Once files are transferred to a Linux computer, a bash script pre-processor (a useful technique on large datasets where syntax modifications are necessary) is used to reformat data as valid array of JSON objects –

stevee@ideapad-530S:~/Arduino/projects$ cat weather_preprocess.bash
#!/bin/bash

for f in data/weather/*.TXT; do
    j="${f%.*}"
    grep "^\[" $f | sed 's/\[//g' | sed 's/\]/,/g' | sed '$ s/.$//' | sed '$ s/.$//'  > $j.json
    sed -i '1 i\\[' $j.json
    echo "]" >> $j.json
    echo $j.json
done

JSON data is an array of objects where each row represents a single log entry indexed by unix timestamp.

Columns represent sensor & computed data – temperature, humidity, air pressure, sun elevation, surise / sunset time and moon phase.

stevee@ideapad-530S:~/Arduino/projects/python$ head -20 ../data/weather/20201015.json
[
{"ts":1602720026,"t":15.5,"h":88,"l":986,"p":102141,"t2":18.8,"a":0.414837,"w":697,"el":-47.86353,"az":2.618189,"lat":50.7192,"lon":-1.8808,"sr":"07:31","ss":"18:14","mn":28},
{"ts":1602720059,"t":15.5,"h":88,"l":988,"p":102140,"t2":18.8,"a":0.166463,"w":692,"el":-47.85925,"az":2.82748,"lat":50.7192,"lon":-1.8808,"sr":"07:31","ss":"18:14","mn":28},
...

Assuming a working Python (v2x) installation and dependencies (Pandas, Mathplorlib, Datetime) are present, we include required libraries and import data from file using Pandas creating a DataFrame in memory table structure –

import os
import json

import matplotlib as mpl
import matplotlib.dates as mdates
import matplotlib.pyplot as plt
import matplotlib.dates as mdates
import pandas as pd
from datetime import datetime as dt

days_to_extract = 90;
path = "../data/weather/"
files = []
frames = []

### Data file path and file format 
for (path, dirs, f) in os.walk(path):
    files = [ fi for fi in f if fi.endswith(".json") ]

### Load JSON data
def load_json_data(filepath, frames):
    with open(filepath) as f:
        d = json.load(f)
        df = pd.DataFrame(d)
        frames.append(df)

### process n days datafiles
for f in files:
    filename = path+f
    bits = os.path.splitext(f)
    datestr = bits[0]
    dtm = datetime.strptime(datestr, '%Y%m%d')
    if dtm >= datetime.now()-timedelta(days=days_to_extract):
    load_json_data(filename,frames)

# complete dataset as DataFrame
df = pd.concat(frames)

In dataset although frequency for sunrise / set times is daily, these are actually logged every 30 mins, creating many duplicate entries –

print df['sr'];

datetime
2021-01-19 00:00:26 17:37
2021-01-19 00:00:59 17:37
2021-01-19 00:01:26 17:37
2021-01-19 00:01:59 17:37
2021-01-19 00:02:26 17:37

To get one entry per day sunrise/set timing column data is resampled to daily frequency ( .resample(‘1D’) ) and any null rows are dropped with .dropna().

This is equivilent to a relational database roll-up or group by query.

sr = df['sr'].resample('1D').min().dropna()
ss = df['ss'].resample('1D').min().dropna()

Now we have a single daily time entry row indexed by date.

2021-01-18 17:35
2021-01-19 17:37
2021-01-20 17:38
2021-01-21 17:40
2021-01-22 17:41
Name: ss, Length: 93, dtype: object

To plot times on Y-Axis values from Pandas Series are extracted into a simple 2d array list.

We call datestr2num() from mathplotlib.dates ( converts date/time string to the proleptic Gregorian ordinal ) to format time as a number –

srt = np.array(sr.values.tolist())
srt = mpl.dates.datestr2num(srt)
sst = np.array(ss.values.tolist())
sst = mpl.dates.datestr2num(sst)

giving values that can be plotted –

[737824.30416667 737824.30486111 737824.30625 737824.30763889
737824.30833333 737824.30972222 737824.31111111 737824.31180556
…]

A linear scatter plot can then be rendered with a few formatting options specified

fig = plt.figure()
ax = fig.add_subplot(111)
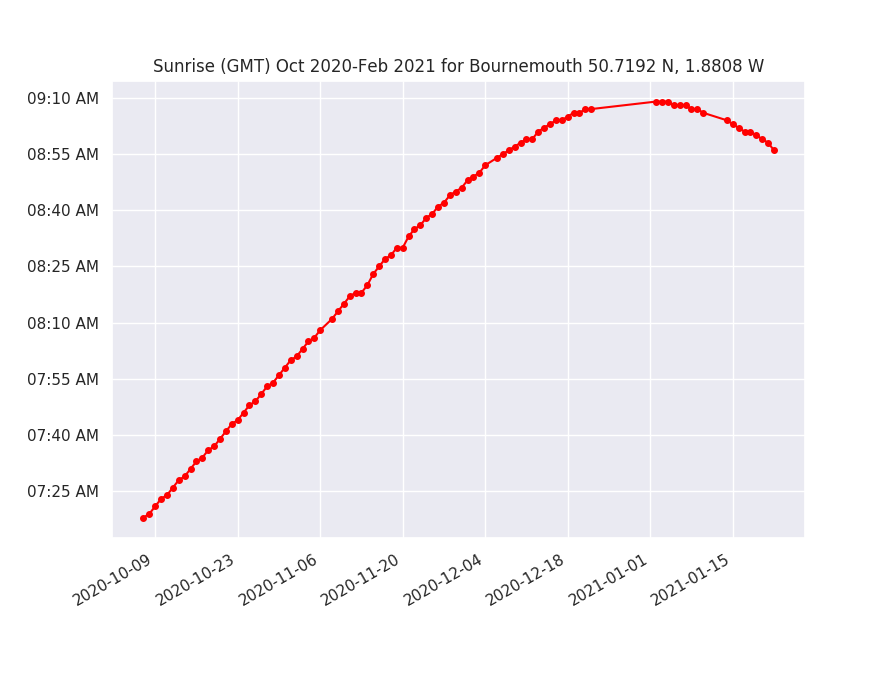
ax.set_title('Sunrise (GMT) Oct 2020-Feb 2021 for Bournemouth 50.7192 N, 1.8808 W')
ax.plot_date(sr.index, srt, '-ok', color='red', markersize=4)
ax.yaxis_date()
ax.yaxis.set_major_formatter(mdates.DateFormatter('%I:%M %p'))
fig.autofmt_xdate()

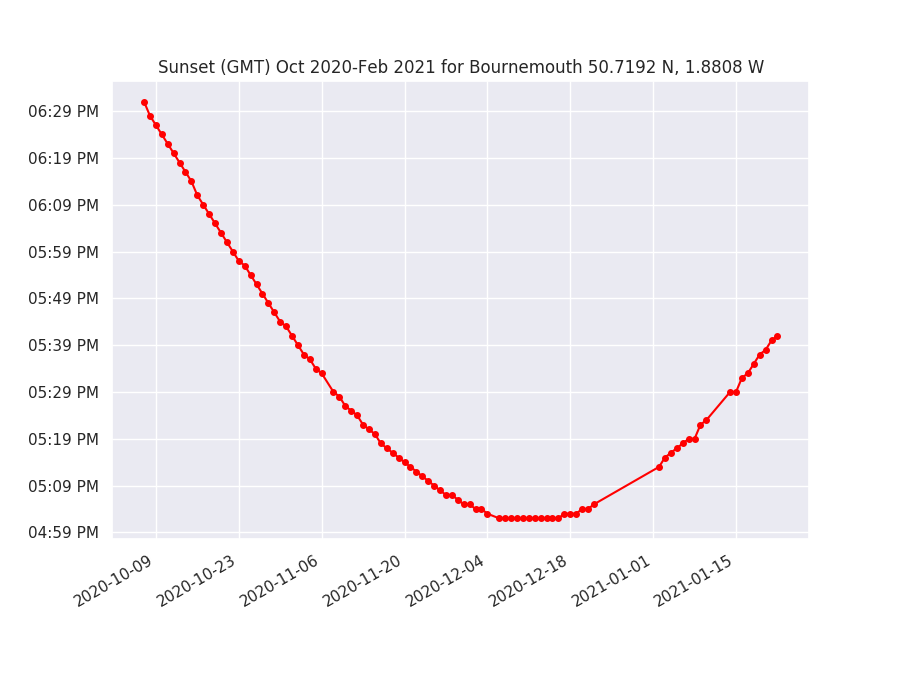
The result is a curve which shows day light hours being influenced as Mid Winter solstice (shortest day) Dec 21st is passed.

Sunrise times visualised as scatter plot
Sunset times

For more info and examples of real time series data charting in Python: https://www.dataquest.io/blog/tutorial-time-series-analysis-with-pandas/

Discussion of Arduino Sunrise / Sunset libraries: http://www.steveio.com/2020/09/03/sunrise-sunset-is-arduino-ahead-of-its-time/

Categories
arduino C/C++ Coding microcontrollers Software weather station

Sunrise / Sunset – Is Arduino ahead of Its Time?

Recently I added Sun Moon Library to my DIY Arduino Weather Station.

Given a location specified as Latitude / Longitude coordinates and a date / time this clever algorithm uses astronomical math routines to provide timing of sunrise, sunset and moon age.

https://www.flickr.com/photos/jannerboy62/31589567761/

In spite of Arduino ATMega328p chipset being only an 8 bit architecture and float data type being low precision ( 6 – 7 decimal digits ) timings output by sun moon are said to be accurate to second scale.

Comparing results with UK Met Office weather forecast during testing I found Arduino sunrise / sunset timings to be out, with a margin or error of around 15 minutes.

Being suspicious of data, one sunny afternoon I found a vantage point and watched sun disappear below horizon, timing the event.

Sure enough Arduino data was indeed inaccurate.

Arduino DIY Weather Station and sensors.

What could be the problem?

While my knowledge of maths is not sufficiently advanced to properly understand each line of Sun Moon library algorithm, to eliminate possibility of faulty code I decided to try another implementation, Dusk to Dawn.

After running a test for same location, result with new library continued to show an inaccuracy of 15 minutes.

Weather Station timing (date / time) is provided by a Real Time Clock (DS3132 module) which is synced from internet via Network Time Protocol (NTP). A quick check showed date and time to be correct, although manual correction for daylight savings time (DST) seemed sub-optimal.

This pointed to a coordinate error.

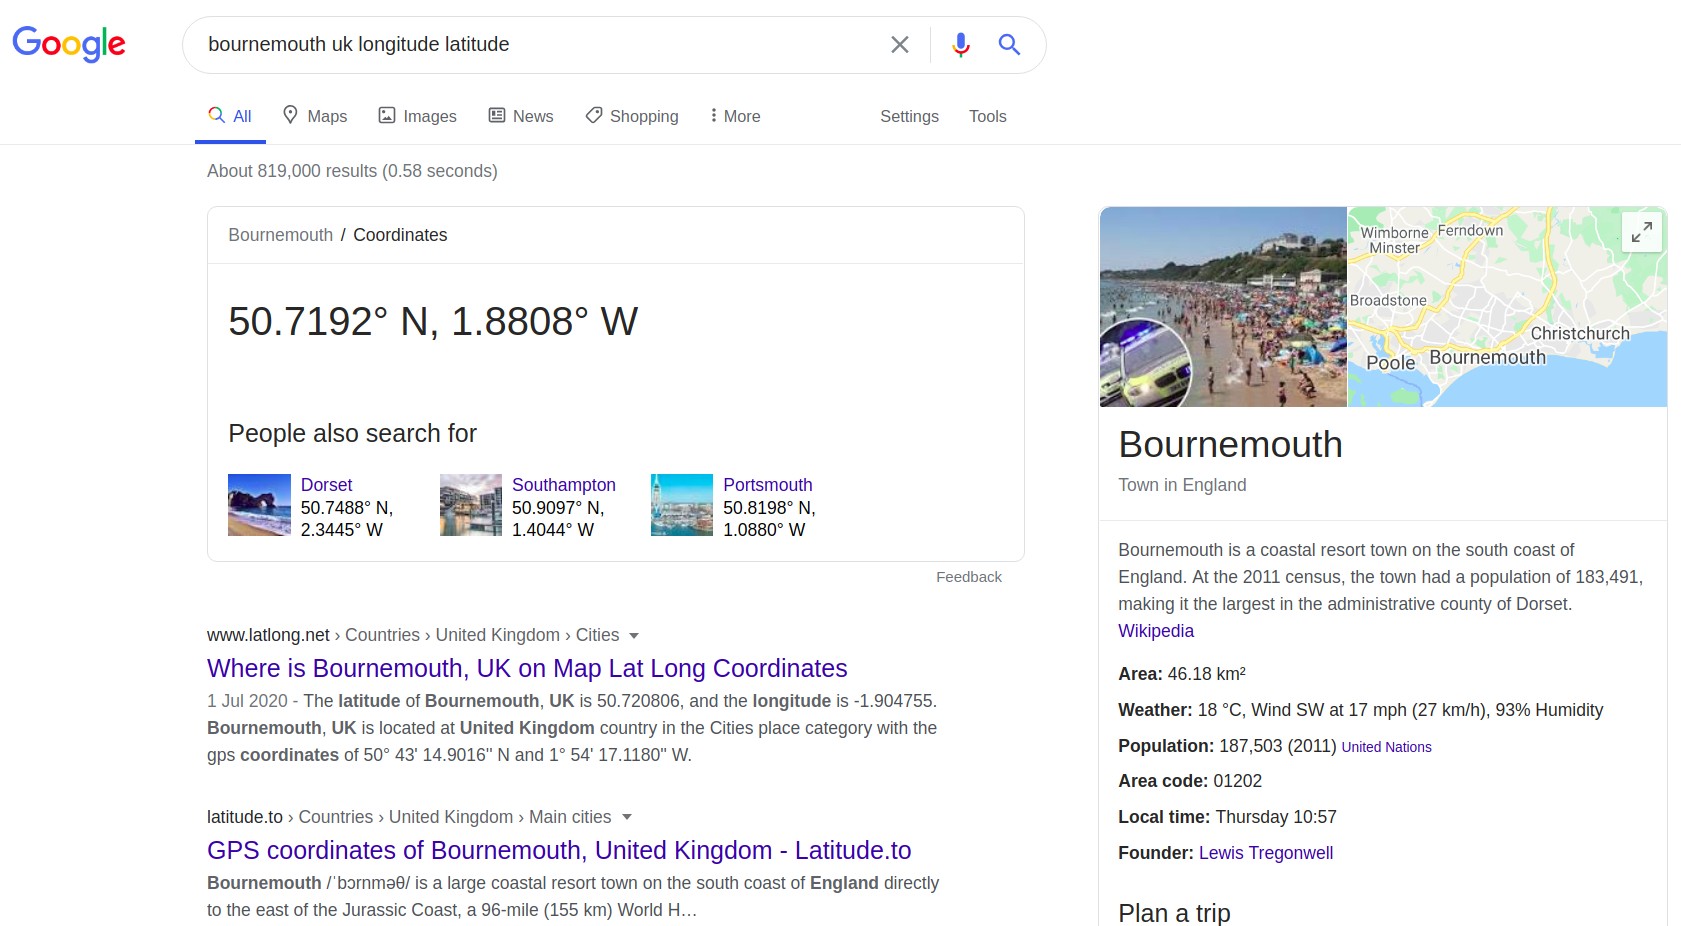
Google gives my location Bournemouth, UK as Longitude / Latitude 50.7192° N, 1.8808° W.

Google results for Latitude / Longitude Bournemouth, UK

These coordinates are defined in Weather Station code as:

// Lat/Long: Bournemouth 50.7192° N, 1.8808° W
#define LOC_latitude    50.7192
#define LOC_longtitude  1.8808

Here was the problem.

Checking cooordinates for another location, London, UK ( 51.5074° N, 0.1278° W ) Arduino gave sunrise / sunset with only a minor ( < 1 minute) difference in timing.

Bournemouth is West of Greenwich Meridian (zero line for Longitude) by approx 107 miles. Each degree of latitude is approximately 69 miles (111 kilometers) apart.

Google gives coordinates (50.7192° N, 1.8808° W) as decimal degrees and “N/S/E/W”, a human friendly representation.

Arduino code expects decimal degrees and Plus/minus symbol.

ISO 6709 International Standard defines Longitude as a number preceded by a sign character. A plus sign (+) denotes east longitude or the prime meridian, and a minus sign (-) denotes west longitude or 180° meridian (opposite of the prime meridian)

Similarly, according to Microsoft, “The latitude is preceded by a minus sign ( – ) if it is south of the equator (a positive number implies north)”.

Updating Weather Station to include latitude minus symbol, code now provided accurate timings –

// Lat/Long: Bournemouth 50.7192° N, 1.8808° W
#define LOC_latitude    50.7192
#define LOC_longtitude  -1.8808

In navigation, the 1 in 60 rule states that for each degree off (or displacement) over a distance of 60 nautical miles (NM), it will result in 1 NM off course

A trans Atlantic journey by boat from Southampton to New York ( 2974.5 nautical miles ), given a similar error in bearing of ~2 degrees might arrive in Boston or possibly Washington.

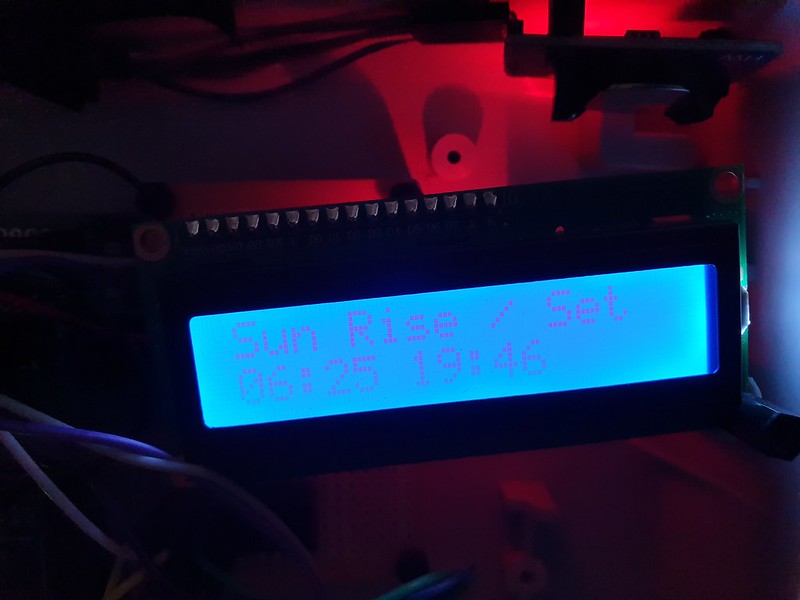
Sunrise / Sunset times on Arduino LCD Weather Station display

We were in agreement at last, today sunrise would occur at 06:25 and sunset at 19:46.

References:

https://github.com/steveio/arduino/blob/master/WeatherStation/WeatherStation.ino

https://en.wikipedia.org/wiki/ISO_6709#Longitude

https://docs.microsoft.com/en-us/previous-versions/mappoint/aa578799(v=msdn.10)?redirectedfrom=MSDN

https://stackoverflow.com/questions/51626412/getting-negative-values-of-latitude-and-longitude

https://www.metoffice.gov.uk/weather/forecast

Categories
circuits Internet of Things microcontrollers sensors Software weather station

Weather Station Wind Vane

What types of sensor can be used for a weather vane? How to track angular position using a rotary encoder? How easy is calibration? What coding considerations for a weather station wind direction project?

Mesopotamian base-60 number system resulted in our idea of 360° in a full circle. Early compasses described 32 points and eight cardinal directions of wind, serving as navigational aids for maritime exploration.

References recorded in ancient China as early as 139 BC described “wind observing fan”. In classical Greece astronomer Andronicus constructed a weather vane at “tower of winds” in Athens. Weather vanes were known in many places of antiquity.

The word “vane” derives from Old English “fane” (Germanic Fahne) signifying “cloth, banner, flag” all of which can be deployed as visual wind direction indicators.

In modern times, absolute and incremental encoders are sensor devices measuring rotary position (angle) and motion. Resolution, precision and accuracy have distinct meaning.

Absolute encoders maintain position during power off or device reset. Incremental motion encoder data is relative, sensors of this type require “homing” (passing a known position) to calibrate.

Lets consider some types of rotary encoder

  • magnetic rotary encoder
  • 360° Potentiometer
  • optical encoder
  • magnetic sensor array

Magnetic Rotary Encoder

Contactless magnetic encoders track a dipole magnet attached to a rotating shaft above sensor, recording rotational angle and direction through a full turn of 360° with high resolution and precision.

Internally hall sensors measure angular position of a magnetic field presented at surface, converting this to a voltage.

On chip digital signal processing (DSP) amplifies and filters planar field data before conversion by Analogue to Digital conversion (ADC).

Having no mechanical friction leads to long expected life span.

A wide operating temperature range (-40 Deg.C to 150 Deg.C) and environmental tolerances (~80% humidity) allow for a wide potential application range.

2/3 wire I2C/SPI programmable interfaces provide standardised micro-controller connectivity and control.

AS5600 Datasheet
MLX90316 Datasheet

Potentiometer 360 degree

Several commercial wind vanes targeted at maritime applications deploy a 360° potentiometer connected directly to vane shaft.

Having a compact, space efficient design, high resolution (degrees of direction) can be tracked.

Detent (stops or clicks) add rotational resistance and a fixed set of positions but increase friction.

Electro-mechanical contacts are subject to mechanical wear and surface corrosion of contact track impacting accuracy, durability and longevity.

Optical Encoder

Optical incremental encoders – IR LED / Sensor pair with a spinning disk interrupter are accurate at very high RPM rates with low sensor latency (rise time).

Resolution is determined by interrupt light “chopper” disk design and relative position is measured by counting rotational sensor ticks.

Quadrature or two channel encoding, with a phase offset, is employed to determine rotational direction.

Calibration, including between device reset/power off is a challenge – sensor pulse counting during rotation must be relative to a fixed/known initial position.

Magnetic Sensor Array

Early compasses recorded 32 points to indicate winds as a navigational aid to sailors.

Wiring 32 sensors together requires considerable soldering & assembly skill. If 4 or 8 bit resolution is sufficient, magnetic linear hall or reed switches might be used – both are contactless, low cost and widely available.

Sensors arranged in a ring array activated by a rotating magnet allow a micro-controller to track position changes.

One approach is to use polling and a GPIO pin per sensor. Pin change interrupts can also be used for state notification.

An analogue multiplexer (CD4051) reduces number of required input pins to 4 (3 address pins, 1 data), optionally a common interrupt enables this to work with an event (interrupt) driven model.

Sensor Implementation – Polling vs Event Model

Polling, reading position at a set frequency (interval), provides consistency and allows simple computation analysis – roll-up averages for example. Higher frequency sampling results in higher precision.

In event model – an interrupt is triggered when sensor state (position) changes.

Recording position data only when direction changes is a low power consumption approach, extending operating duration of a battery powered device, especially on windless days.

To implement event driven design with a multiplexer poses a challenge, at circuit level a common interrupt line wired with isolating diodes to each sensor is required.

A change to any individual sensor triggers an interrupt, micro-controller can then check each multiplexer channel to determine position.

Calibration – how to determine magnetic north?

A compass bearing is required to determine direction relative to cardinal directions.

Wind vanes in a fixed position are manually calibrated. Electronic sensor devices can resolve orientation relative to magnetic compass.

Wind direction is defined by World Geodetic System (WGS) as direction from which wind blows and is measured clockwise from geographical north, namely, true north (meteorology) or in aviation reporting relative to magentic north. 

Visualisation – Wind Rose and Polar Distribution Charts

Wind roses, a type of polar bar chart provide a visualisation of wind distribution: direction and magnitude (velocity) frequency at a location over a given time interval.